TV shows' ratings visualised as graphs
Tuesday, March 25, 2014

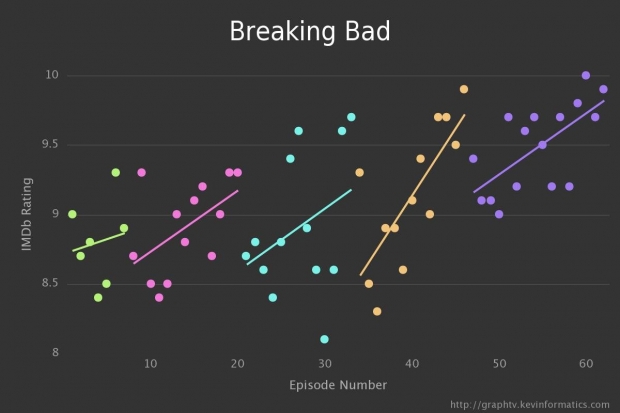
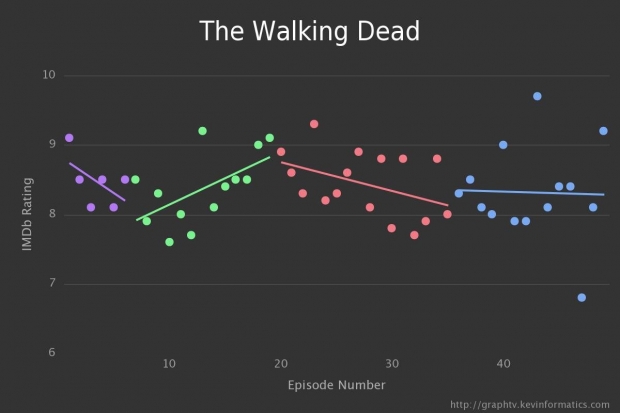
GraphTV is one of biologist/programmer Kevin Wu's web projects, that creates interactive charts for TV shows, based on their ratings.
Graph TV is a visualization tool which graphs tv show ratings by episode. Each season is assigned a different color and linear regressions are calculated for each season as well as for the entire series. Each point on the graph displays the episode title, rating, and other data. The data points are clickable and will open its IMDb entry. The graphs are also exportable for offline use.


View more - after the jump


via


0 comentarii: