
Infographic: The world as 100 people
Wednesday, March 27, 2013
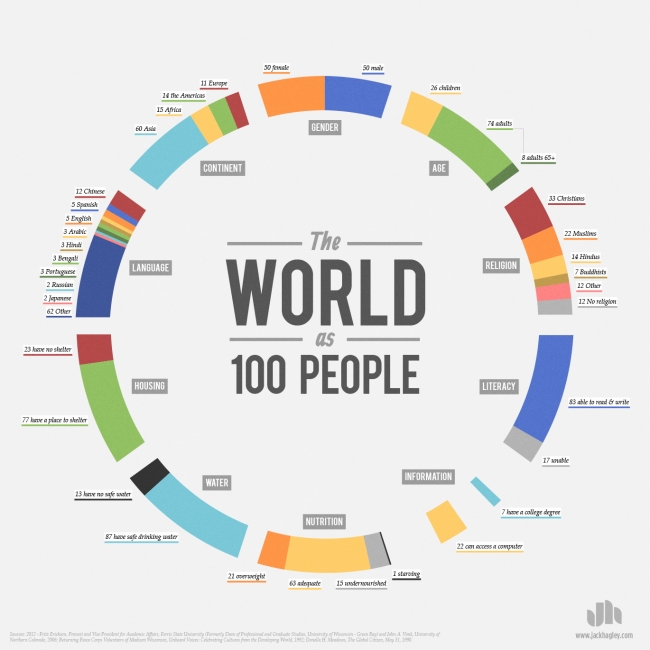
Graphic designer Jack Hagley uses statistics data to create this visual breakdown of the world population by categories such as religion, language, gender, age, literacy, and nutrition.
bigger
Visual.ly | via

bigger
Visual.ly | via


0 comentarii: